Analyzing metrics, adjusting strategies, and explaining results to stakeholders is an everyday task for Google Ads managers. But it may have an endless cycle feeling, which results in frustration.
Are you also spending more time managing data than optimizing campaigns? Then this article is for you.
These time-consuming tasks are repetitive and don’t help improve performance. But with the right approach, you can streamline them and focus more on strategy.
In this post, we’ll cover five Google Ads tasks that waste hours each week, and show solutions to fix them. On top of that, we’ll also share bonuses that automate manual methods, saving you even more time.

1. Analyzing campaign performance across multiple dimensions
The challenge:
To understand what’s driving (or draining) performance, you need to analyze data across multiple dimensions (devices, geographies, age groups, and keyword match types). To do so, you need to export data, build pivot tables, and manually sift through spreadsheets. However, manually exporting this data, building pivot tables and analyzing reports take hours every week.
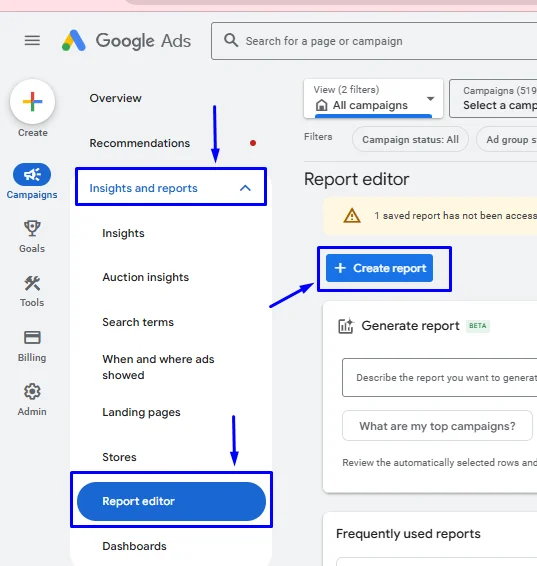
Step 1: Open the Report Editor
- Sign in to Google Ads and click on the Reports icon 📊 (found in the top navigation bar).
- Select “Report Editor” from the dropdown.
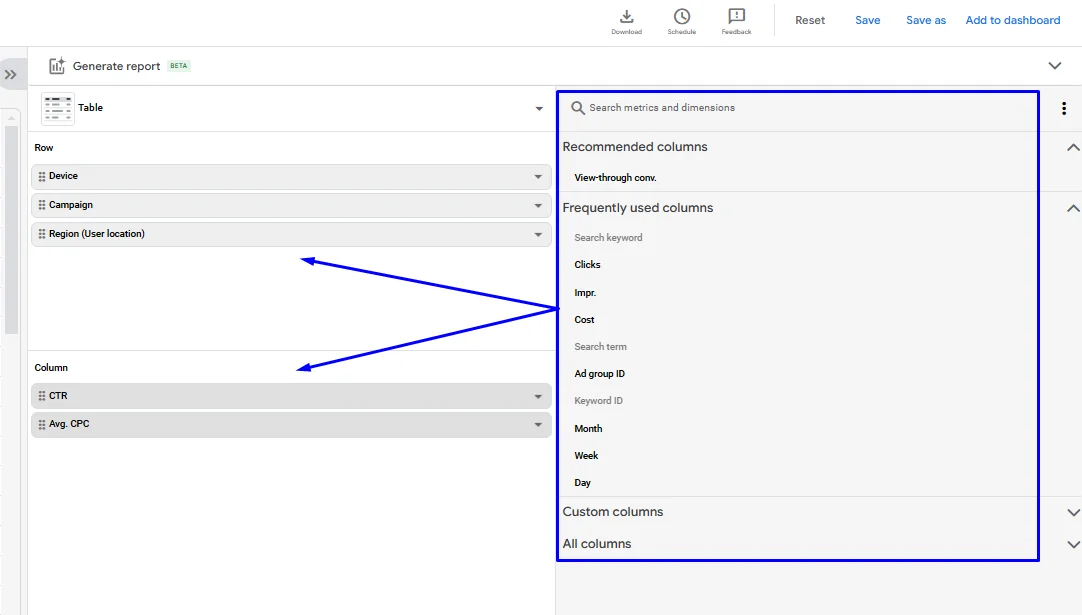
Step 2: Build your custom report
- Click on “+” (New Report) and select “Table” or “Pivot Table”, depending on how you want to analyze data.
- On the left panel, drag and drop key metrics and dimensions:
- Metrics: Conversions, Cost per Conversion (CPO), CTR, CPC
- Dimensions: Campaign, Device, Location, Audience (or other segmentations you need)
- Use the Segment button to break down data by device, location, or audience.
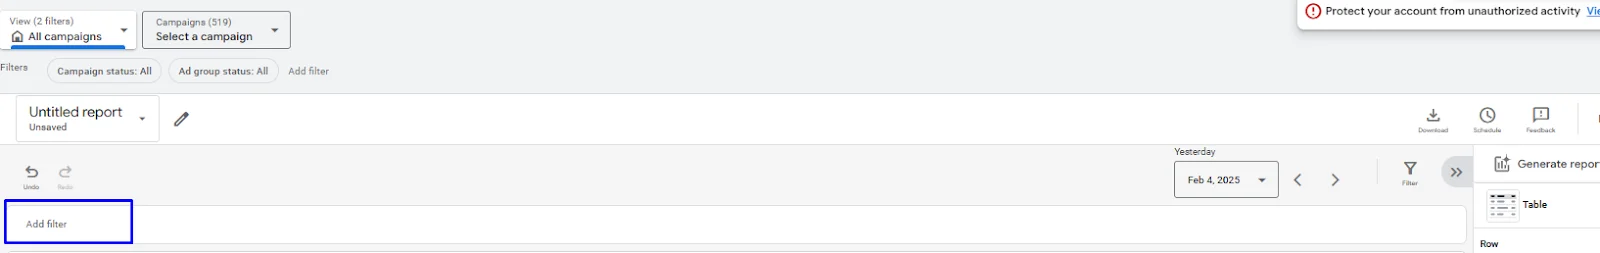
Step 3: Analyze & filter low-performing segments
- Apply filters (e.g., filter out campaigns with high cost per conversion or low CTR).
- Use the pivot table option to summarize data across multiple dimensions.
Estimated time spent: 4–6 hours per week
Alternative way: Get the same insights in minutes instead of hours
Step 1: Access AdsFlash
- Go to AdsFlash and log in via your Google account.
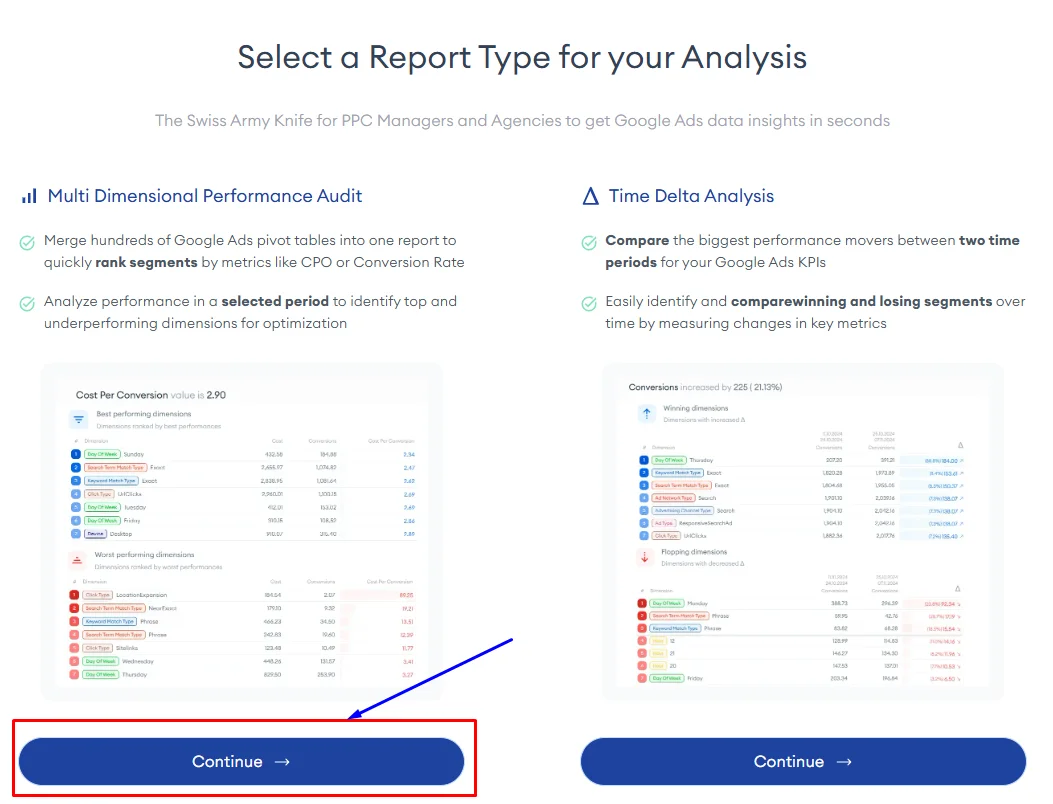
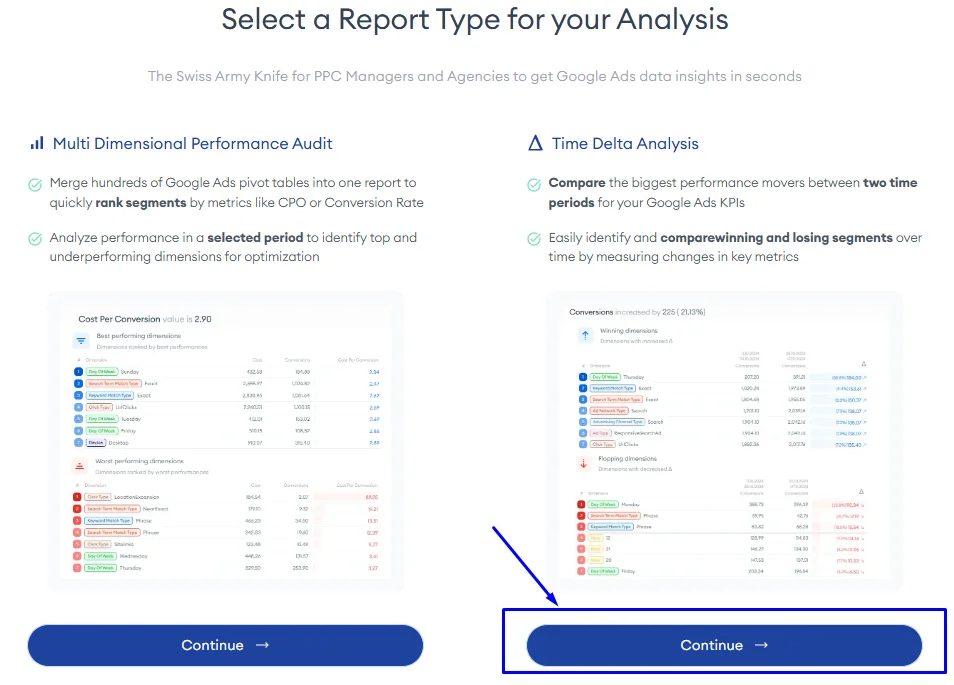
Step 2: Select “multidimensional performance audit“
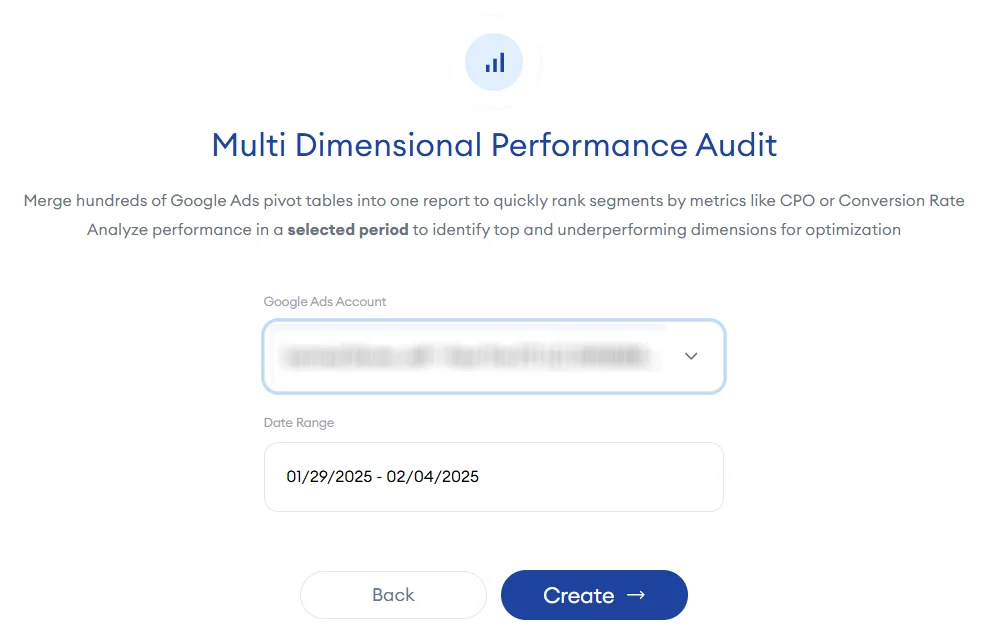
Step 3: Select Google Ads account and date range
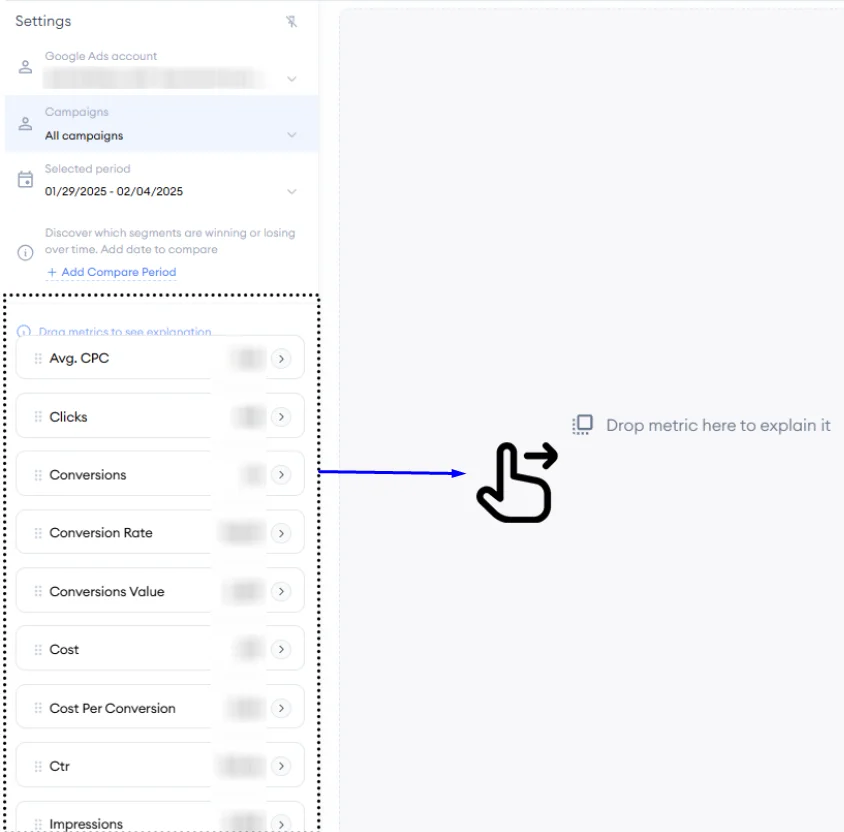
Step 4: Drag and drop your metrics
- Use the left panel to quickly select Clicks, Conversions, Cost per Conversion, CTR, CPC, and other key performance metrics.
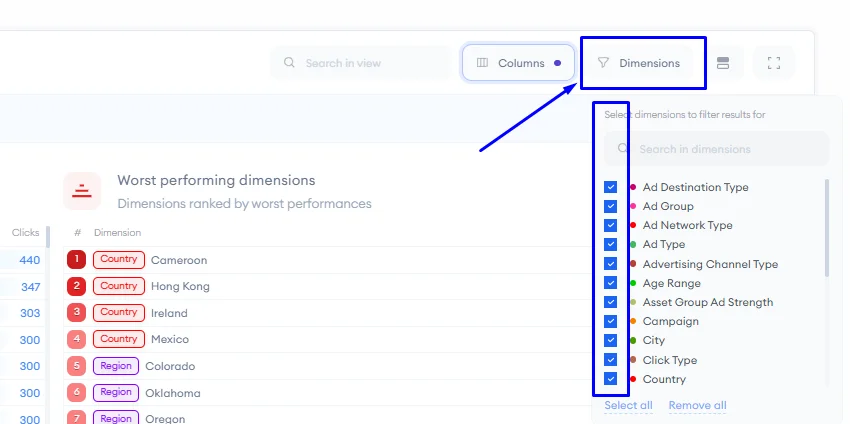
Step 5: Choose the dimensions you want to analyze
- Click on the “Dimensions” tab and select key breakdowns like Device, Country, Campaign, Ad Group, and Match Type.
- Instantly view the best and worst-performing segments without the need for spreadsheets.
Estimated Time Spent: 15 minutes per week
2. Comparing and tracking ads’ performance over time
The challenge:
Comparing different time periods (e.g., last month vs. this month) is crucial to measure progress. However, doing this manually across multiple campaigns is time-consuming and error-prone. Especially if you’re copy-pasting data into Excel.
How to do it in Google Ads:
Step 1: Open the Report Editor
- Sign in to Google Ads and click on the Reports icon 📊 (found in the top navigation bar).
- Select “Report Editor” from the dropdown.
Step 2: Build a Time-Based Report
- Click on “+” (New Report) and select “Table” or “Pivot Table”, depending on the data format you prefer.
- Drag and drop key metrics like:
- Metrics: Clicks, Conversions, CTR, CPC, ROAS
- Dimensions: Campaign, Device, Audience, Match Type
- Use the “Date Range” filter to compare different time periods.
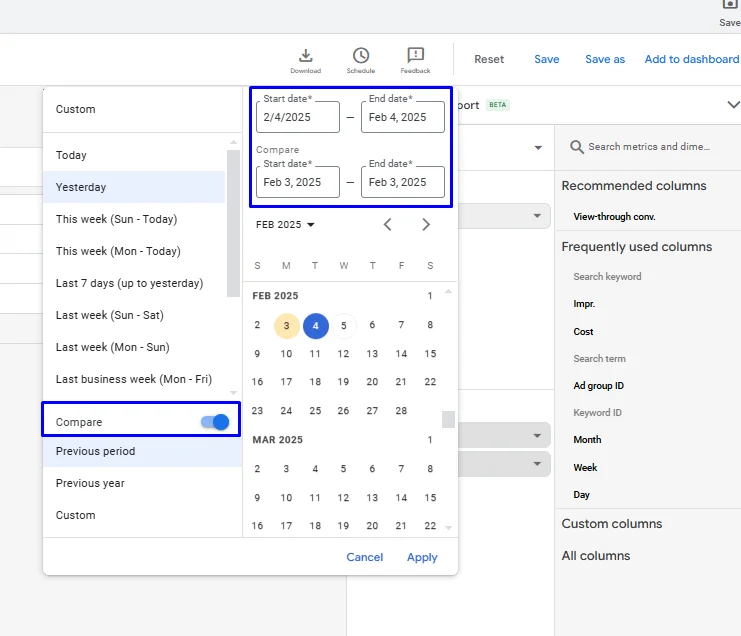
Step 3: Analyze trends and identify performance changes
Apply filters to highlight campaigns with performance fluctuations.
- Use pivot tables to break down the trends across different dimensions.
- Click Save to store your report for future analysis.
- Export reports or manually copy-paste data into Excel for further breakdown.
Estimated time spent: 2–3 hours per report
Alternative way: Simplified time-delta analysis
Step 1: Access AdsFlash
- Go to AdsFlash and log in via your Google account.
Step 2: Time delta analysis
Step 3:Select Google Ads Account and Date Range
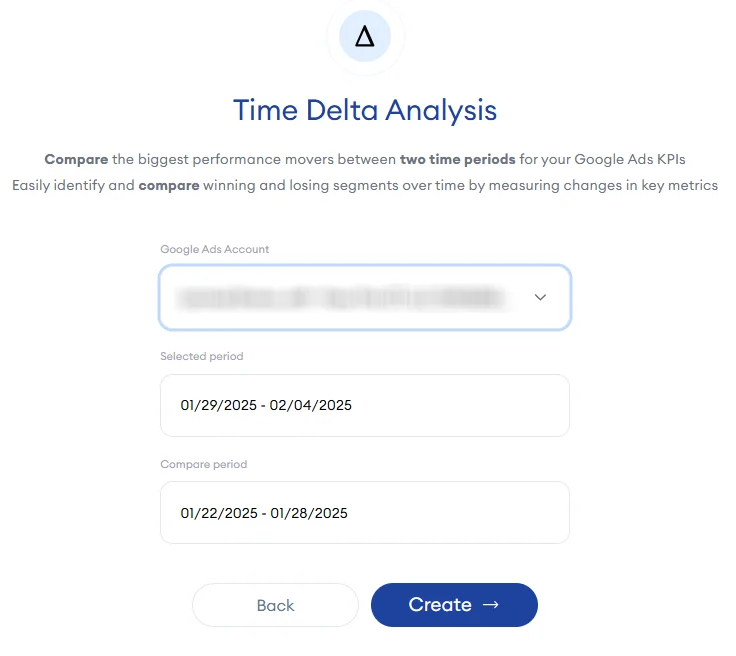
Step 4: Drag and drop your metrics
Use the left panel to quickly select Clicks, Conversions, Cost per Conversion, CTR, CPC, and other key performance metrics.

Step 5: instantly spot performance changes
- Use pre-built trend analysis to quickly detect increases or drops in key metrics.
- Identify winning and losing segments automatically without exporting data.
3. Identifying underperforming keywords
The challenge:
Every campaign has high-CPC, low-converting keywords that drain the budget. Finding them without manually sifting through rows of search term data is exhausting. This manual process can lead to missed opportunities and unnecessary ad spend.
How to do it in Google Ads
Step 1: Open Google Ads Report Editor
- Sign in to Google Ads and click on the Reports icon 📊 in the top navigation bar.
- Select “Report Editor” from the dropdown menu.
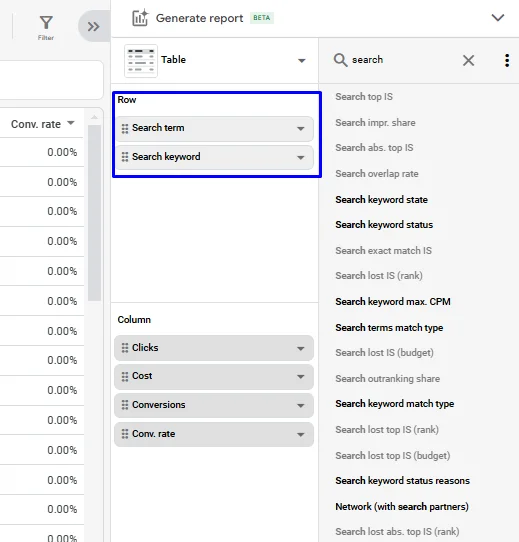
Step 2: Build a Keyword Performance Report
- Click “+” (New Report) and choose “Table” depending on how you want to structure your data.
- Drag and drop key metrics and dimensions to analyze keyword performance:
- Metrics: Clicks, Impressions, CPC, Cost, Conversions, Conversion Rate etc.
- Dimensions: Keyword, Search Term, etc.
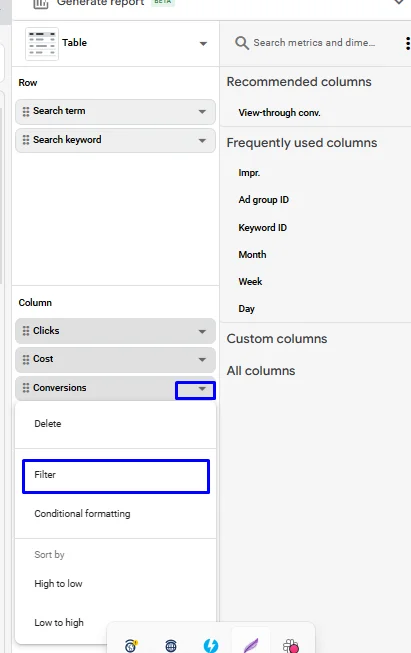
Step 3: Apply filters to find underperforming keywords
- Set up filters to automatically detect budget-draining keywords, such as:
- CPC greater than your target threshold
- Conversion rate lower than your campaign average
- Keywords with high spend but zero conversions
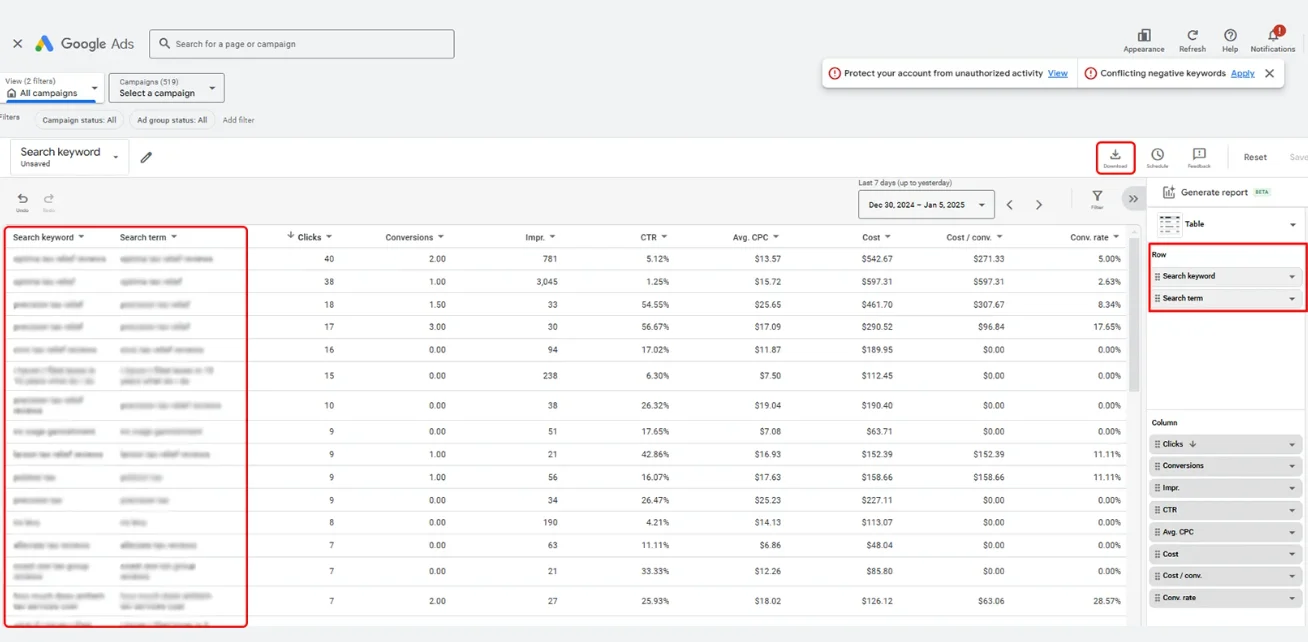
Step 4: Review and optimize your keywords
- Identify keywords that are costing too much without delivering conversions.
- Adjust bids for expensive, low-converting keywords.
Add negative keywords to prevent budget waste on irrelevant searches.
Estimated time spent: 5+ hours per week
Alternative way to analyze search terms efficiently
Automating your Google Ads reports makes it easier to spot weak keywords. This structured method saves you time and helps find new opportunities, so you won’t waste hours in spreadsheets.
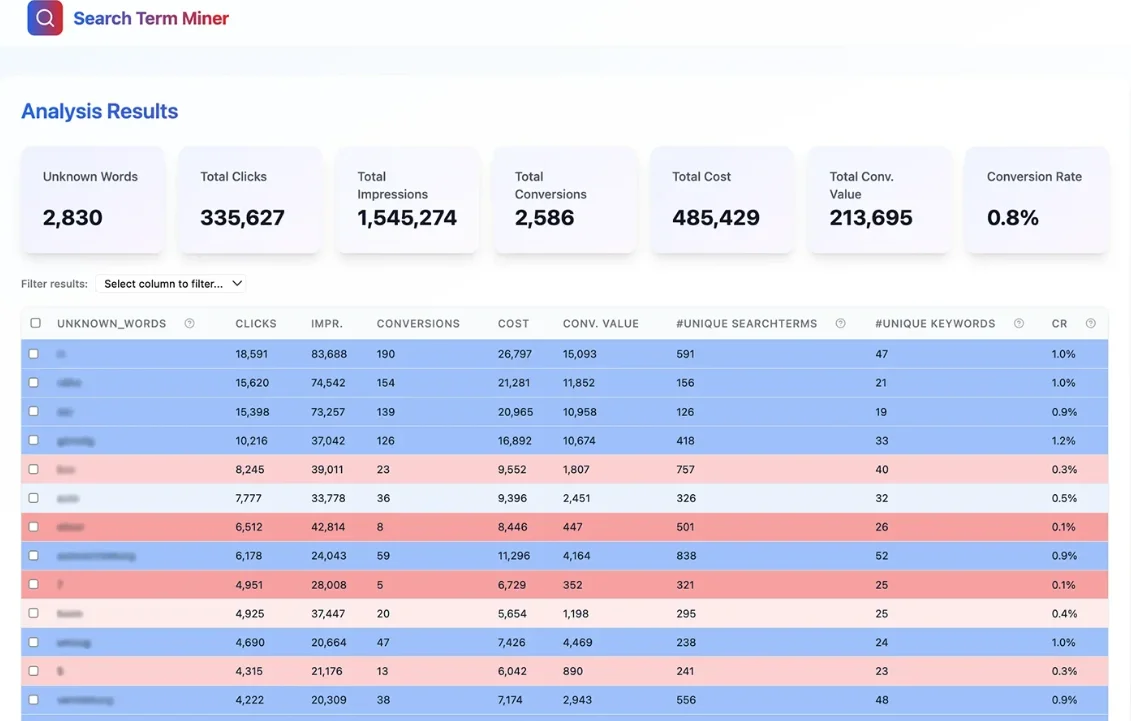
How to simplify the process with Search Term Miner
Step 1: Export your search term report
Download your Search Term Performance Report (CSV) from Google Ads.
Step 2: Upload your file to Search Term Miner
Drag and drop your file into Search Term Miner. No registration required.
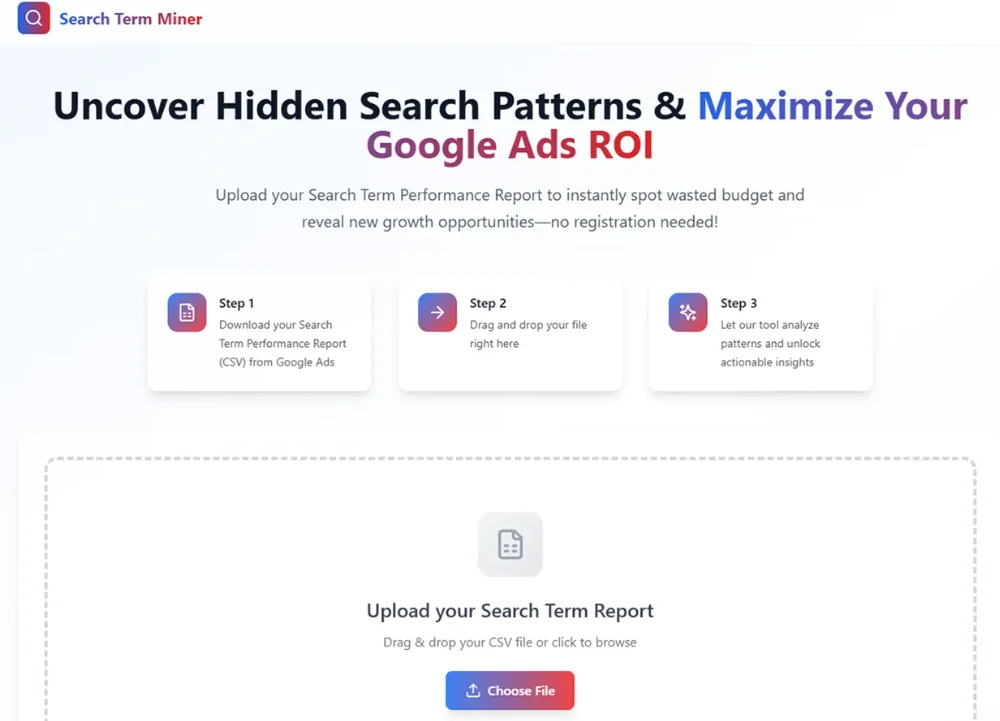
Step 3: Instantly identify budget drains & growth opportunities
- Automatically detect high-CPC, low-converting terms across all campaigns.
- Perform n-gram analysis to uncover hidden keyword trends.
- Get color-coded insights to easily spot which keywords deserve more budget or should be excluded.
- Add negative keywords to prevent budget waste on irrelevant searches.
Estimated time spent: 15–20 minutes per week
4. Understanding competitor performance in Auction Insights
Google Ads Auction Insights provides valuable data on how your ads compare to competitors, but the standard report is difficult to interpret and lacks visual clarity. Manually analyzing this data across multiple campaigns can be time-consuming and complex, making it harder to optimize bidding strategies and maintain a competitive edge.
The challenge:
Manually interpreting the Auction Insights table in Google Ads UI can be time-consuming and limits strategic analysis due to its static format.
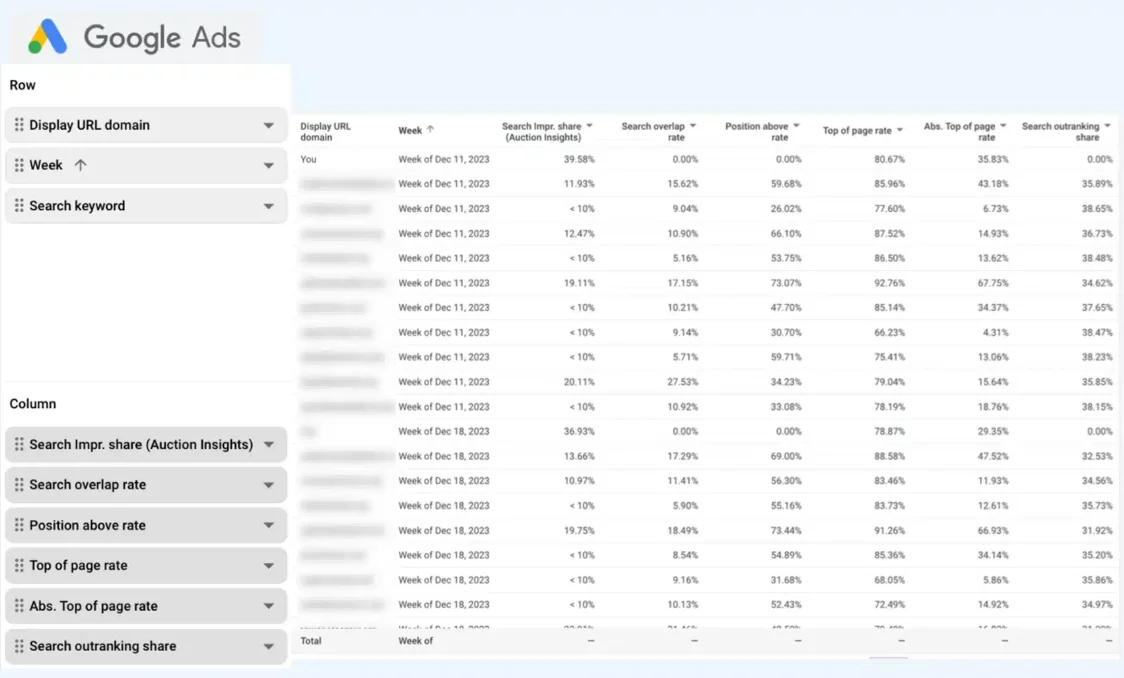
How to Do It in Google Ads (Manual Process using Report Editor)
Step 1: Check Auction Insights in Google Ads UI
- Sign in to Google Ads and navigate to the Campaigns, Ad Groups, or Keywords section.
- Click on “Auction Insights” to view competitor performance data.
- The Auction Insights table in Google Ads UI provides basic visibility into key metrics like Search Impression Share, Position Above Rate, and Overlap Rate, but:
- It lacks deeper trend analysis over time.
- Comparing multiple competitors can be overwhelming in a single static table.
- It’s difficult to filter and focus on specific keywords or timeframes directly in the UI.
A more efficient way: Visualizing Auction Insights data instantly
Manually analyzing Auction Insights requires CSV exports, pivot tables, and multiple filters. A structured and simple approach allows you to instantly visualize and benchmark competitor data without manual effort.
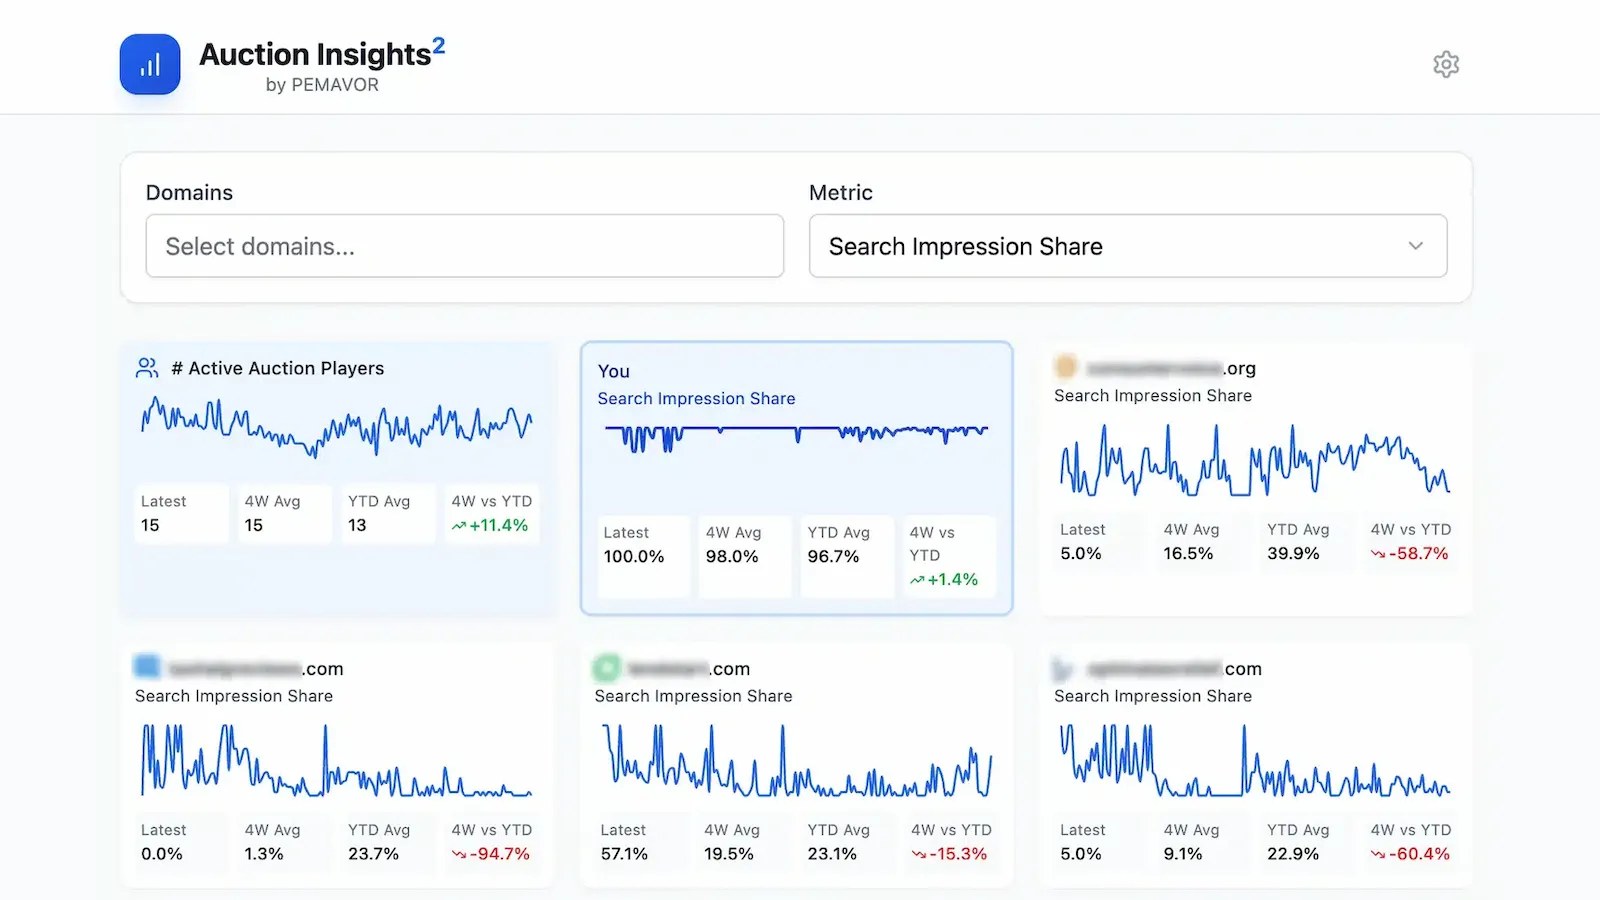
How to simplify the process with the Auction Insights Tool
Step 1: Export Auction Insights from Google Ads
- Download the Auction Insights Report (CSV) from Google Ads Report Editor.
- Include Week and Display URL Domain as mandatory columns.
Step 2: Upload the CSV to the Auction Insights Tool
- Drag and drop your CSV file into the Auction Insights Tool.
Step 3: Instantly visualize and analyze Auction Insights
- Get interactive charts to compare Search Impression Share, Position Above Rate, and Competitor Overlap.
- Identify which competitors are dominating auctions and where you’re losing visibility.
- Use color-coded metrics to quickly pinpoint performance trends and bidding inefficiencies.
Estimated time spent: 15-20 minutes per week
Easy to use system for PPC Management
Managing complex Google Ads accounts can feel overwhelming. Trust us, we’ve been there. After years of working with sophisticated, high-budget campaigns, we built AdsFlash, Search Term Miner, Auction Insights Tool, and more tools to make your life easier.
No more manual spreadsheets or endless pivot tables, just clear performance insights to help you focus on what really matters: optimizing your campaigns.
Contact us to learn how PEMAVOR’s sophisticated solutions and PPC automation can elevate your Google Ads performance.